
CIE Diagram
The C.I.E. Chromaticity Diagram is a plot of X versus Y for all visible colors. The Commission Internationale de l’Elcairage (C.I.E.) XYZ model defines three primaries mingled in an additive manner called X, Y and Z that can be combined to match any color humans see. This relates to the tristimulus theory of color perception, which states that the human retina has 3 kinds of cones with peak sensitivities to 580 nm (“red”), 545 nm (“green”) and 440 nm (“blue”).
The Y primary was defined to match the luminous efficiency function of the human eye. X and Z were obtained based on experiments involving human observers. The chromaticity values are defined as:
x = X / (X+Y+Z)
y = Y / (X+Y+Z)
z = Z / (X+Y+Z)
Knowing x and y, z can be found as z = 1 – x – y.
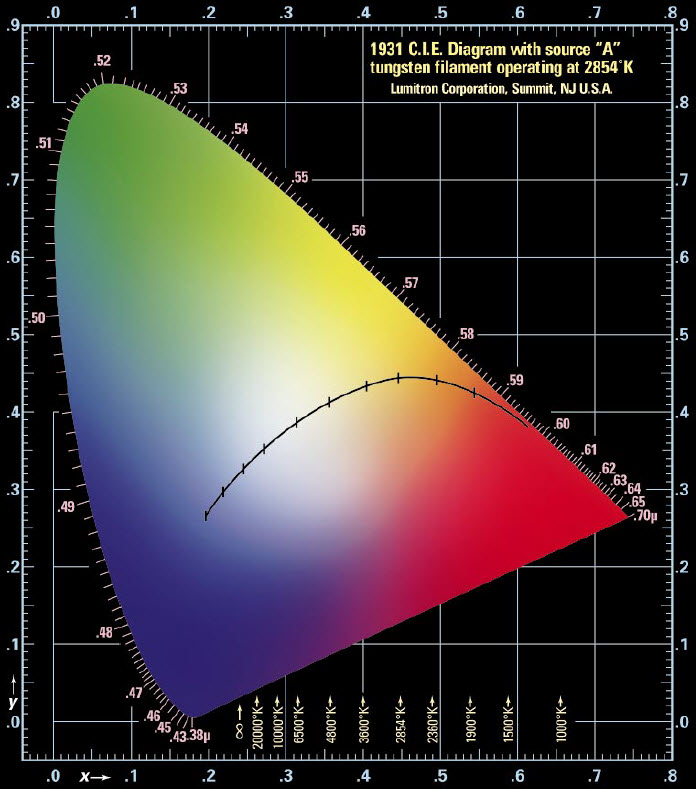
Each point on the edge of the C.I.E. Chromaticity Diagram denotes a pure color of a specific wavelength.
White is at the center where all colors combine equally (x = y = z = 1/3).

Lighting...Your Way!
Call 908.508.9100 or email us at sales@lumitron.com with your product questions or to place an order.